
The Tree Report is a handy way to provide details of the work being undertaken by your clients or contractors.
Once you have run a report you can select to save the results to a tree report through the report actions buttons.

Click Tree Report.
The report settings popup appears. This will vary depending on the exact configuration of your system. Select the options as required:
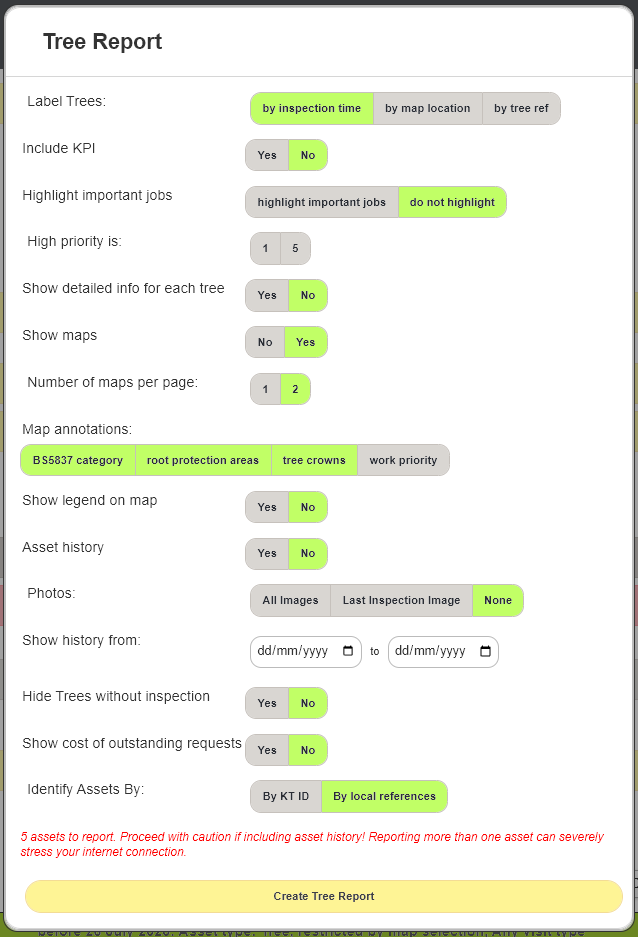
- Label Trees: Select the order in which trees are labelled. Time, by longitude/lattitude, or by tree reference numbers added manually during inspections.
- Include KPI: Include pie charts detailing species health and vitality and life stage breakdown.
- Highlight Important Jobs: Should jobs at the highest priority be highlighted in the report?
- High Priority is: Set 1 or 5 as the highest priority level. This also affects what is highlighted as important.
- Show detailed info for each tree: Should the report show basic or detailed info on the structural properties of the trees?
- Show Maps.
- Number of Maps per Page.
- Map Annotations: Select from the standard items to be included within the report Maps.
- Show legend on map: Add a key to the map that explains the Map Annotations.
- Asset History: This will include every inspection on every asset. This can generate very large reports so should only be selected for small groups of assets.
- Photos: Images only from the last inspection on each asset, all images from all inspections on each asset, or none.
- Show history from: Use this date range if you need to show only inspections from within a specific Time frame. This only affects the Asset history. The details info of each asset will still show the current state of the asset.
- Hide Trees without inspection: If there are no inspections on the assets within any set timeframe, they are excluded from the report.
- Show costs of outstanding requests: If your system supports pricing for Service requests, you can include the costs in your report.
- Identify Assets by: Choose whether to use the KaarbonTech asset IDs, or the local IDs.
Click Create Tree Report to generate the report pages.
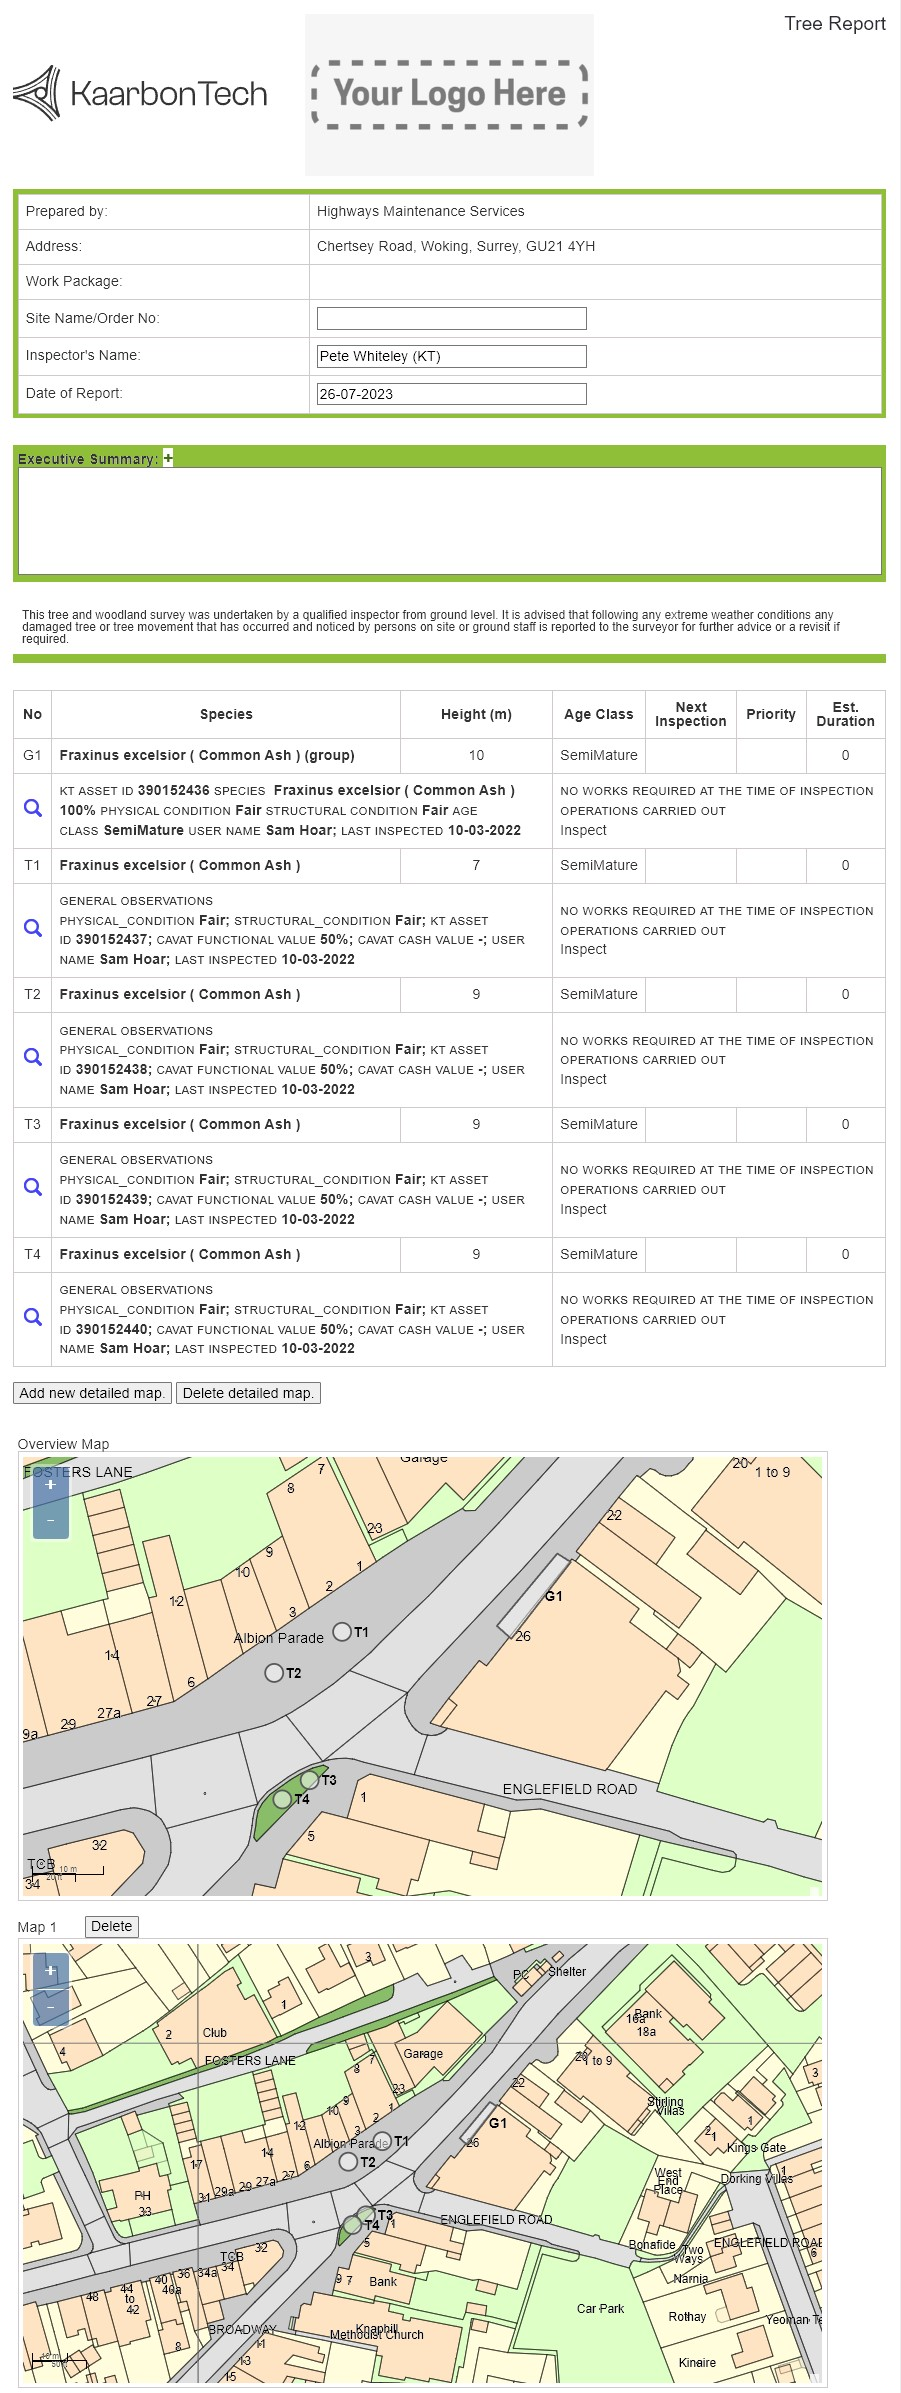
Once generated, you can either print the report or save it as a PDF to share it with your stakeholders and clients.