
Now that your risk scenario has been created, your next step is to assign each of the Vulnerability and Importance factors scores to determine the risk factor of each asset. These scores are then used to generate a risk factor score for each asset. Once scored, you can then use the resulting Risk Matrix to set the optimal cleaning frequencies for your assets.

At any time during this process, you can click View List to return to the list of scoresheets. Any unsaved changes will be lost.
You can also click Duplicate to make a copy of the scoresheet. This allows you to quickly make a copy of an existing scenario if you want to edit the weighting scores and save it as a separate scenario.
Scoresheet Risks and Weightings

In the Importance and Vulnerability risks and weightings sections, every factor selected in the previous step is displayed here. You can assign scores to each, which are added up to give each asset an Importance and a vulnerability score. The assets are then assigned a cycle based on these scores.
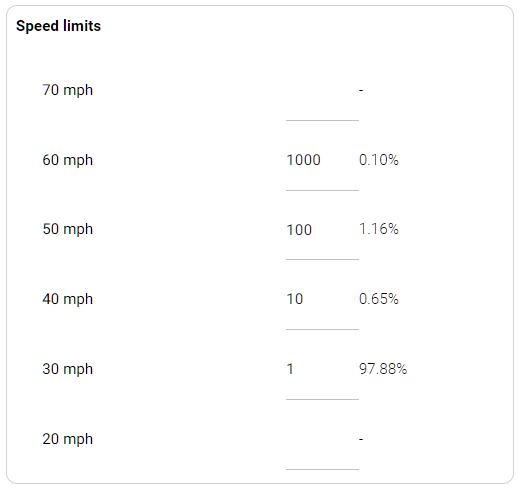
Live data is shown where available, giving the percentage of assets that meet the criteria.
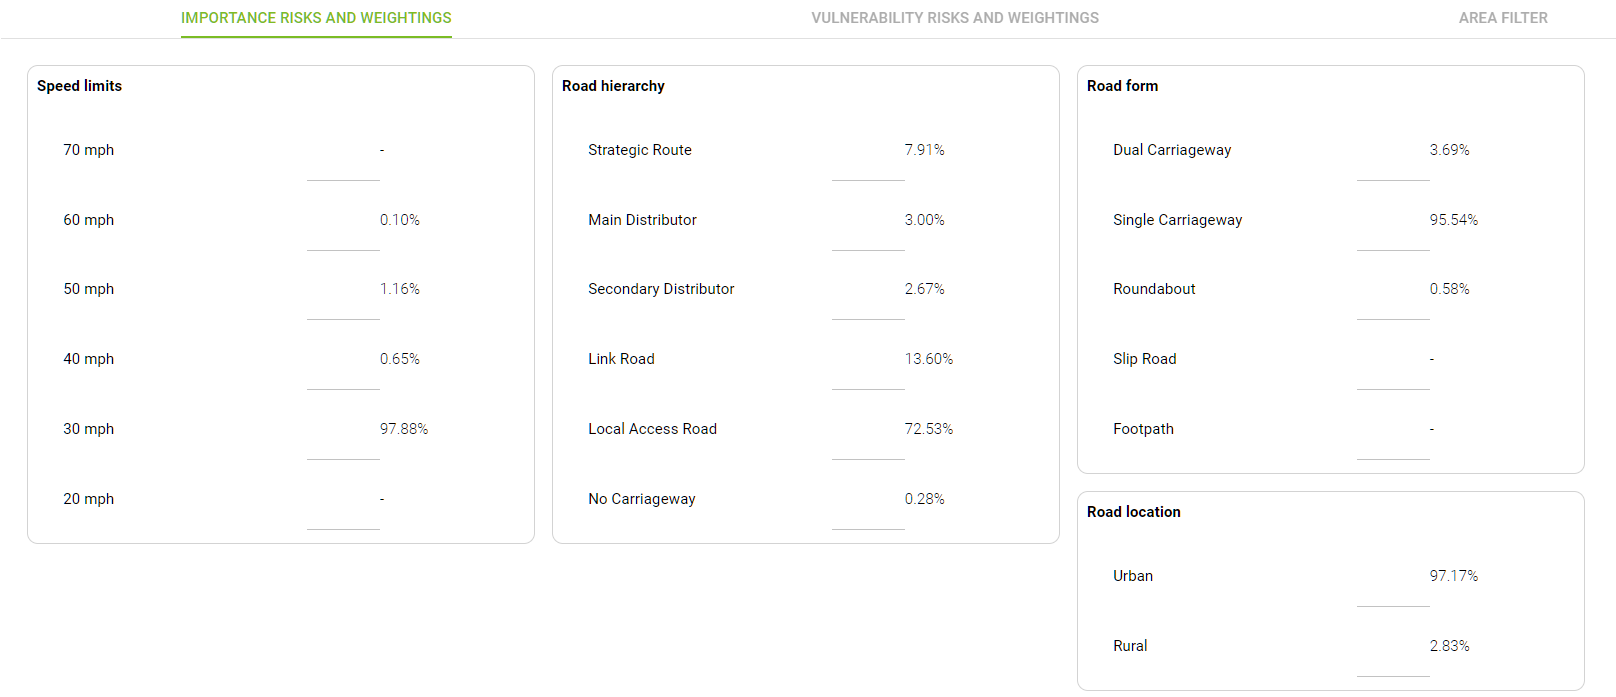
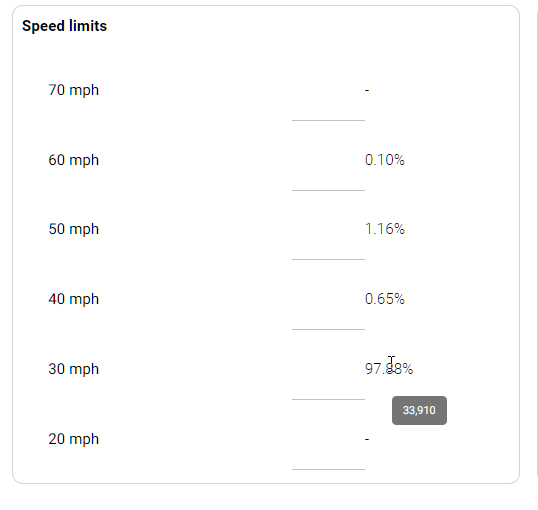
Hover the mouse over any percentage to see the number of individual assets that make up that percentage.
For each value, in each factor, assign a score.
The higher the score, the higher the eventual risk score will be. For example, When scoring Speed Limits, you can assign higher scores to high speed roads, leading to them having a higher importance score.
Or for the Silt Level, you could assign higher scores to 100% and 75% average silt levels, leading to a higher vulnerability score.
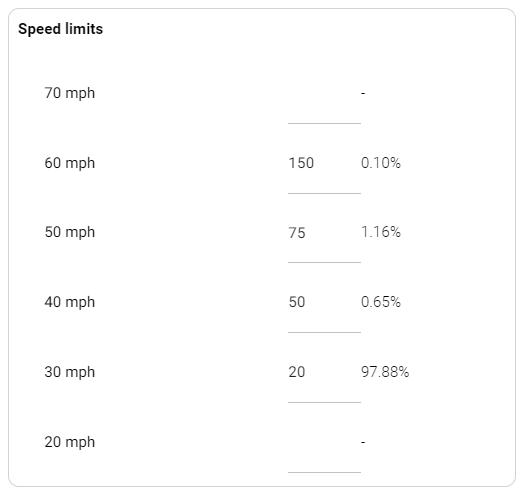
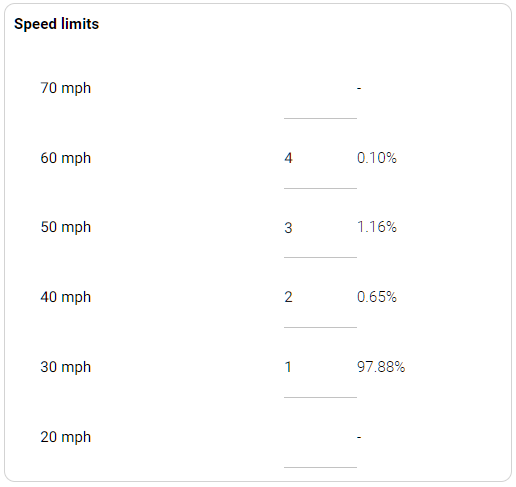
Scores can be assigned with any numerical value, but consideration should be given to the scoring range. If there is little variation within the range of scores assigned to a factor, you may find all assets are assigned the same cycle. Scoring as follows might generate such a situation.
If there is too much variation within the scoring range, however, you may find you have more cycles than you need. Scoring as follows may generate cycles that range from monthly to 5 yearly, leading to a much more complicated cleaning program than is necessary.
The Area Filter section allows you to filter scoresheet results by area. This is useful if you want to manage risk in certain areas only, and manage the cycles in other areas manually.
Saving the Scoresheet
Once you have completed all the available scorings, Click on Save to save the current version of the scoresheet. This saves the scorings but does not generate any scores. This allows you to come back and edit it later if you choose.

Click on Save And Generate Scores to complete the risk scenario. This finalises the scores and begins the process of assigning cycle lengths to the assets.
When the scenario is finished and scores are generated, the software creates a grid to visualise cycle lengths which you can use to set the cleaning cycles of the assets.
Risk Scores and Other Actions
When the cycle Lengths have been saved, it becomes possible to Apply Risk Scores To Assets.
Click on Notes to add them to the scoresheet or Update them.
It is also possible to archive a risk scenario from here.
