Each item in the View menu allows you to change what is shown on the map.
Click Zoom extents to zoom out to the greatest extent of the home page map.

Base Layer
You can view different types of imagery for your basemap layer. select from the list.

Select either Map, Aerial Photos, or a combination of the two with Hybrid.
Aerial Photos are only available at certain levels of zoom. Click None to remove the map background.

Hybrid can be used to gain more information when adding new assets or moving ones at a location.
Overlays
Click a box to display information. Click it again to dismiss the information. Note that certain options are based on the particular installation. This means you may not see all options in the list below and others may be included.

Wards: Borders of wards are shown as a red line. You may also see other area types, such as Parishes, Districts or Divisions.

Private Roads: Red polygons show roads that are not maintained at public expense, such as new developments that have not yet been adopted. Assets in these zones may be referred to third parties for maintenance, or maintained at the expense of the land owner.

Highway Boundary: Yellow polygons show the extent of the highway boundary. Assets in these areas are maintained by the local authority.

Priority Zones: Areas of special priority as designated by the local authority.
- Green - minor priority
- Orange - moderate priority
- Red - significant priority
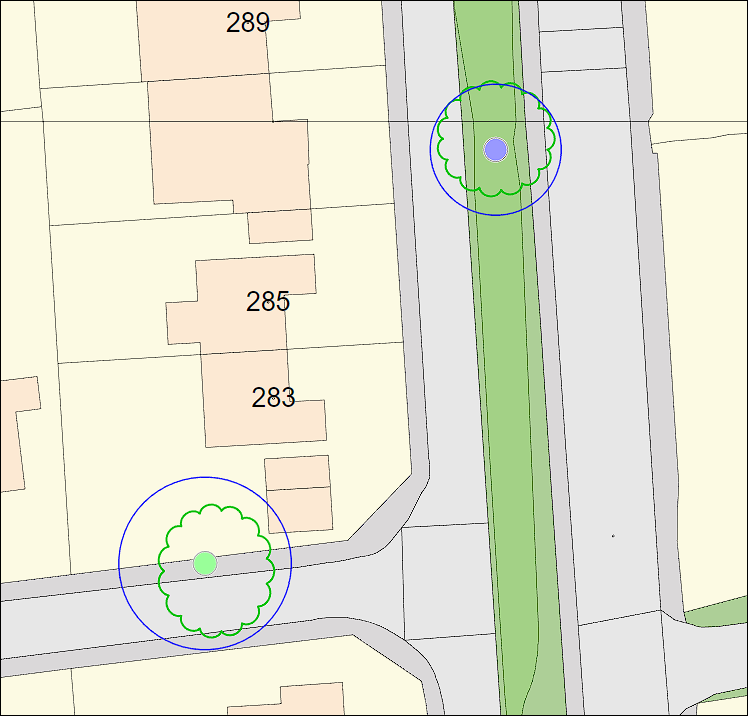
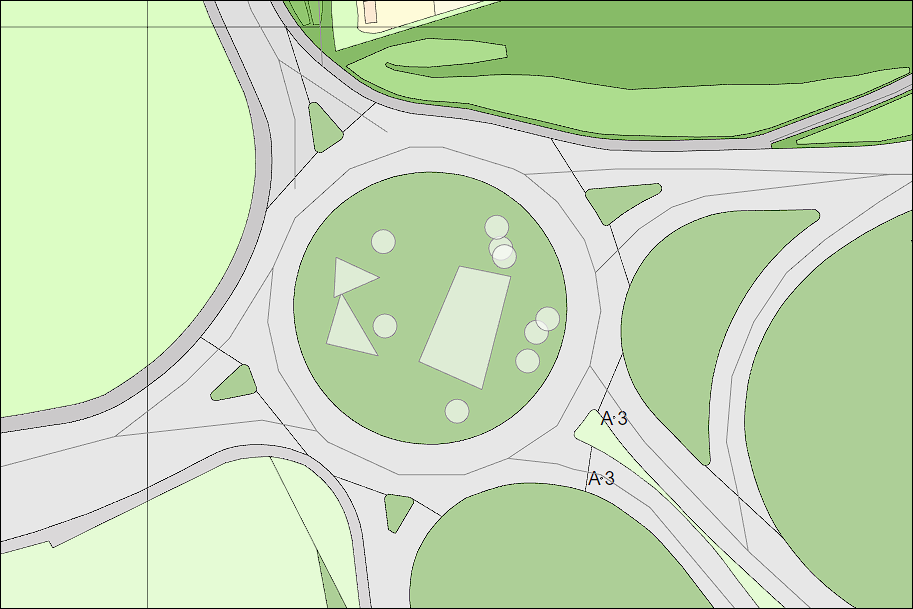
Road Segments: If enabled, road segments appear as assets that can be marked off as inspected and appear as lines on the map along the centreline of roads.
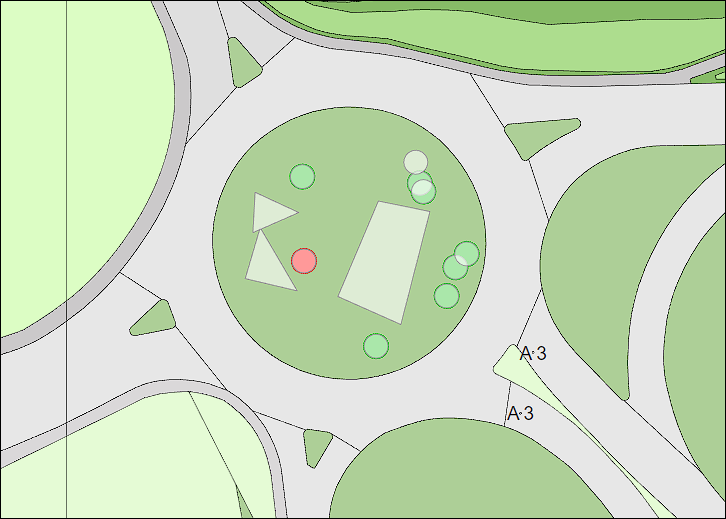
Trees: Trees are represented by circles for individual trees, and polygons for groups of trees. You may also see assets marked with an X for archived assets, such as trees that have been felled; or assets that are maintained by third parties.
Structural Cond: This will colour the trees on the map according to the structural condition that was recorded in their last known inspection.
Health/Vitality: Colours the assets on the map in the same way, but dependent on the Health and Vitality recorded on their last inspection.
The values corresponding to each colour for these filters is as follows:
- Green - Good or Fair
- Orange - Poor
- Red - Dead or Dangerous
Tree Crowns: If the canopy spread for north, east, south and west were recorded in any previous inspection, the most recent data will be drawn on the map for each individual tree in green.
Root Protection Area: If the DBH has been recorded on a previous inspection, the most recent data is drawn on the map for each individual tree as a blue circle.
BS5837 Category: If recorded in a previous inspection, the map is coloured to display this on the map for individual trees:
- Green - Category A: High
- Blue - Category B: Medium
- Grey - Category C: Low
- Red - Category U: Unretainable