
The Gully SMART drainage report is a handy way to provide details of the work being undertaken to your clients or contractors.

Once you have run a report you can select to save the results to a drainage report through the report actions buttons.

Click Drainage Report.
The Drainage Report settings popup appears. This will vary depending on the exact configuration of your system. Select the options as required:
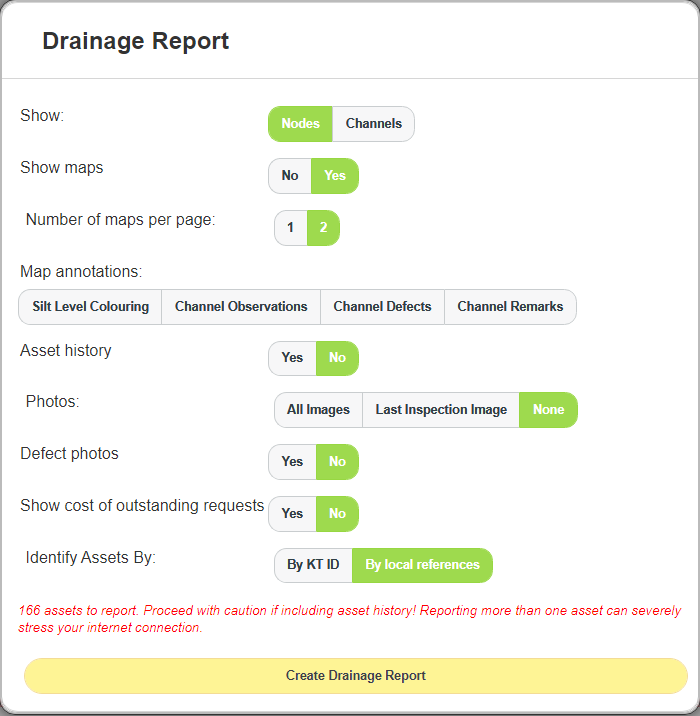
- Show: Select the asset types to be shown, Nodes, Channels or Both.
- Show Maps: Should the report include maps of the assets or just the bare information?
- Number of maps per page: How many maps per a4 sized report page.
-
Map Annotations:
- Silt level Colouring - Gullies are coloured according to the last recorded silt level, as per the normal mapping features.
- Channel Observations/Defects/Remarks - Include CCTV Remarks and Defects on the map on channels.
- Asset History: Include a detailed history of every visit and work request on each asset in the report. Not recommended to use on anything more than a few assets as this can make the report get very long with large numbers of assets.
-
Asset Photos:
- All Images: This includes every photo taken of each asset. Again, this can cause reports to get very large with large numbers of assets.
- Last Inspection Image: Returns only images form each assets most recent inspection.
- None: No inspection photos are included.
- Defect Photos: Include any photos of channel defects taken during CCTV surveys.
Click Create Drainage Report to generate the report pages.
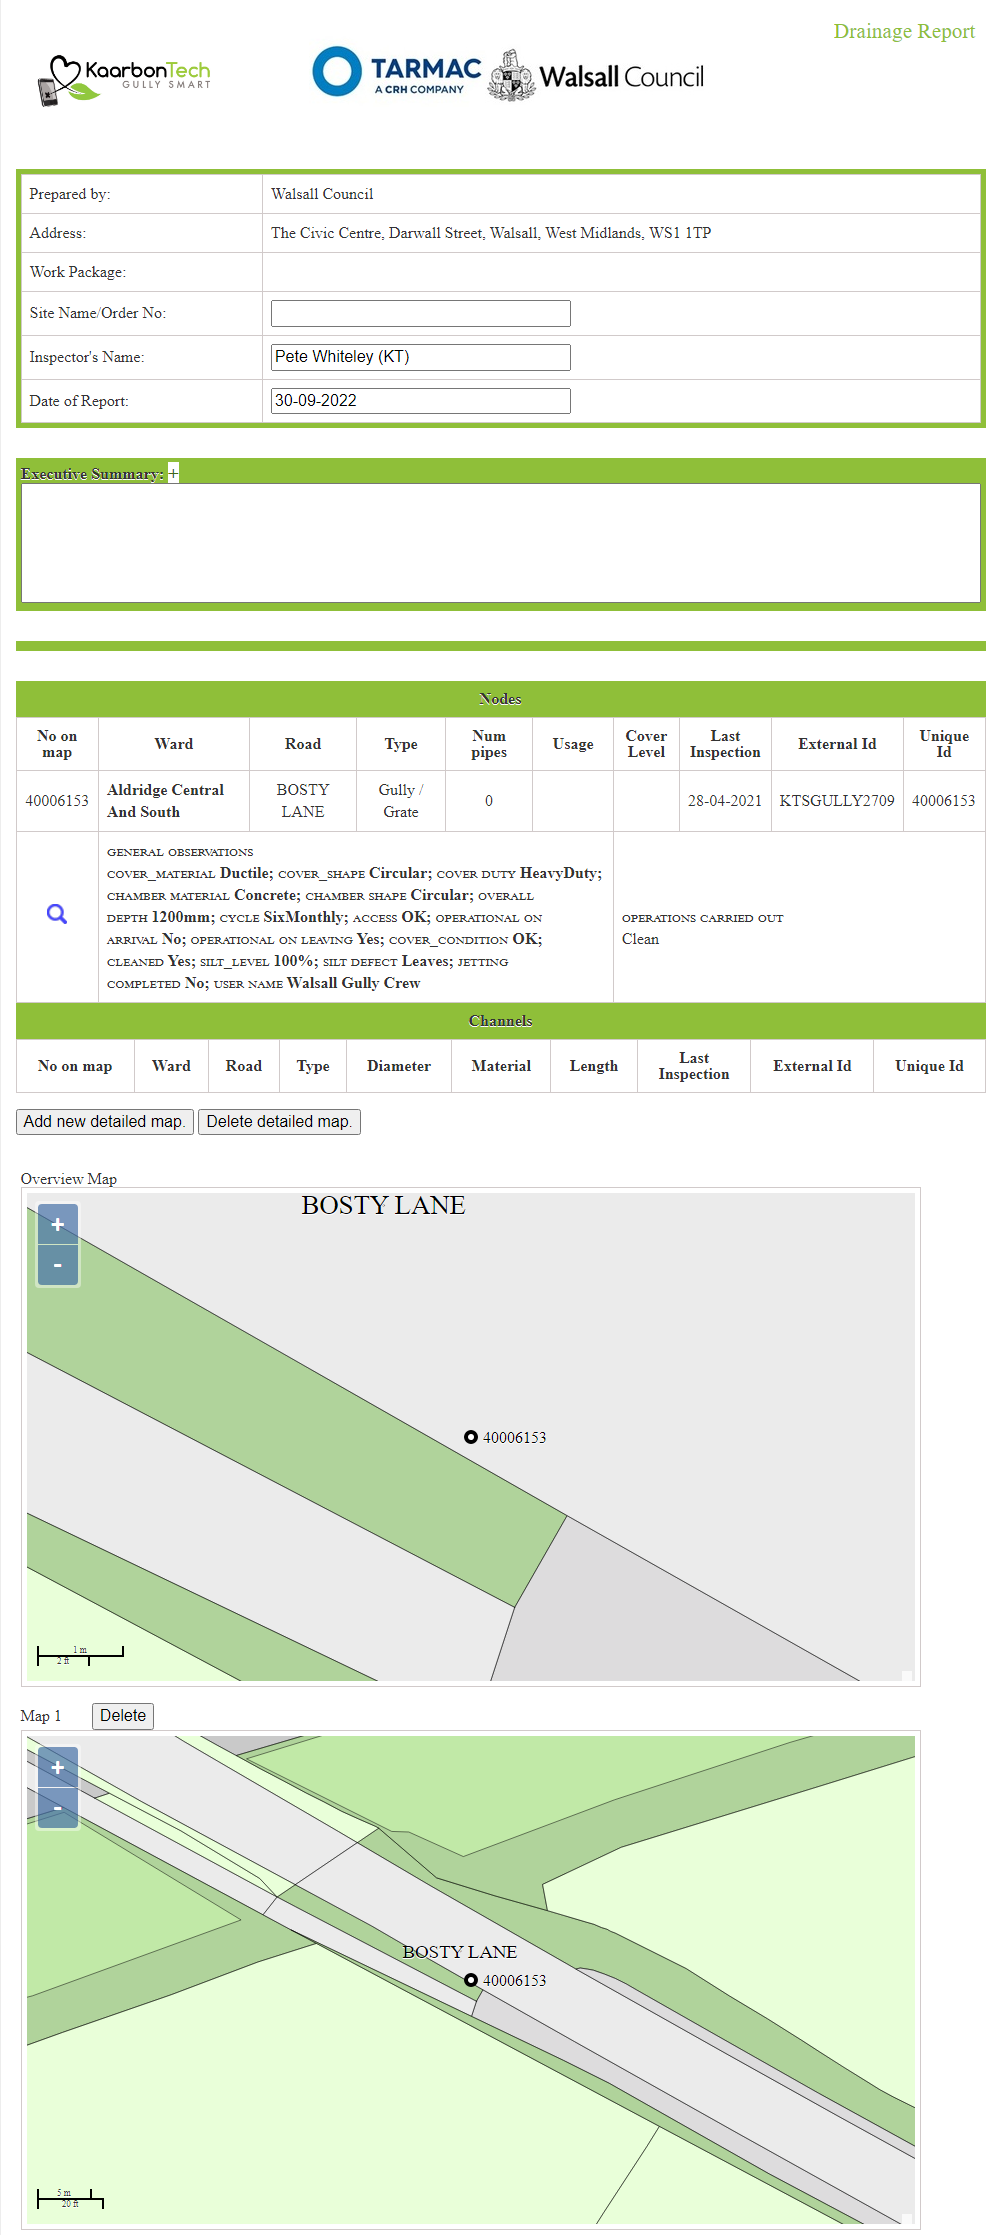
Once generated, you can either print the report or save it as a PDF to email it to your stakeholders and clients.