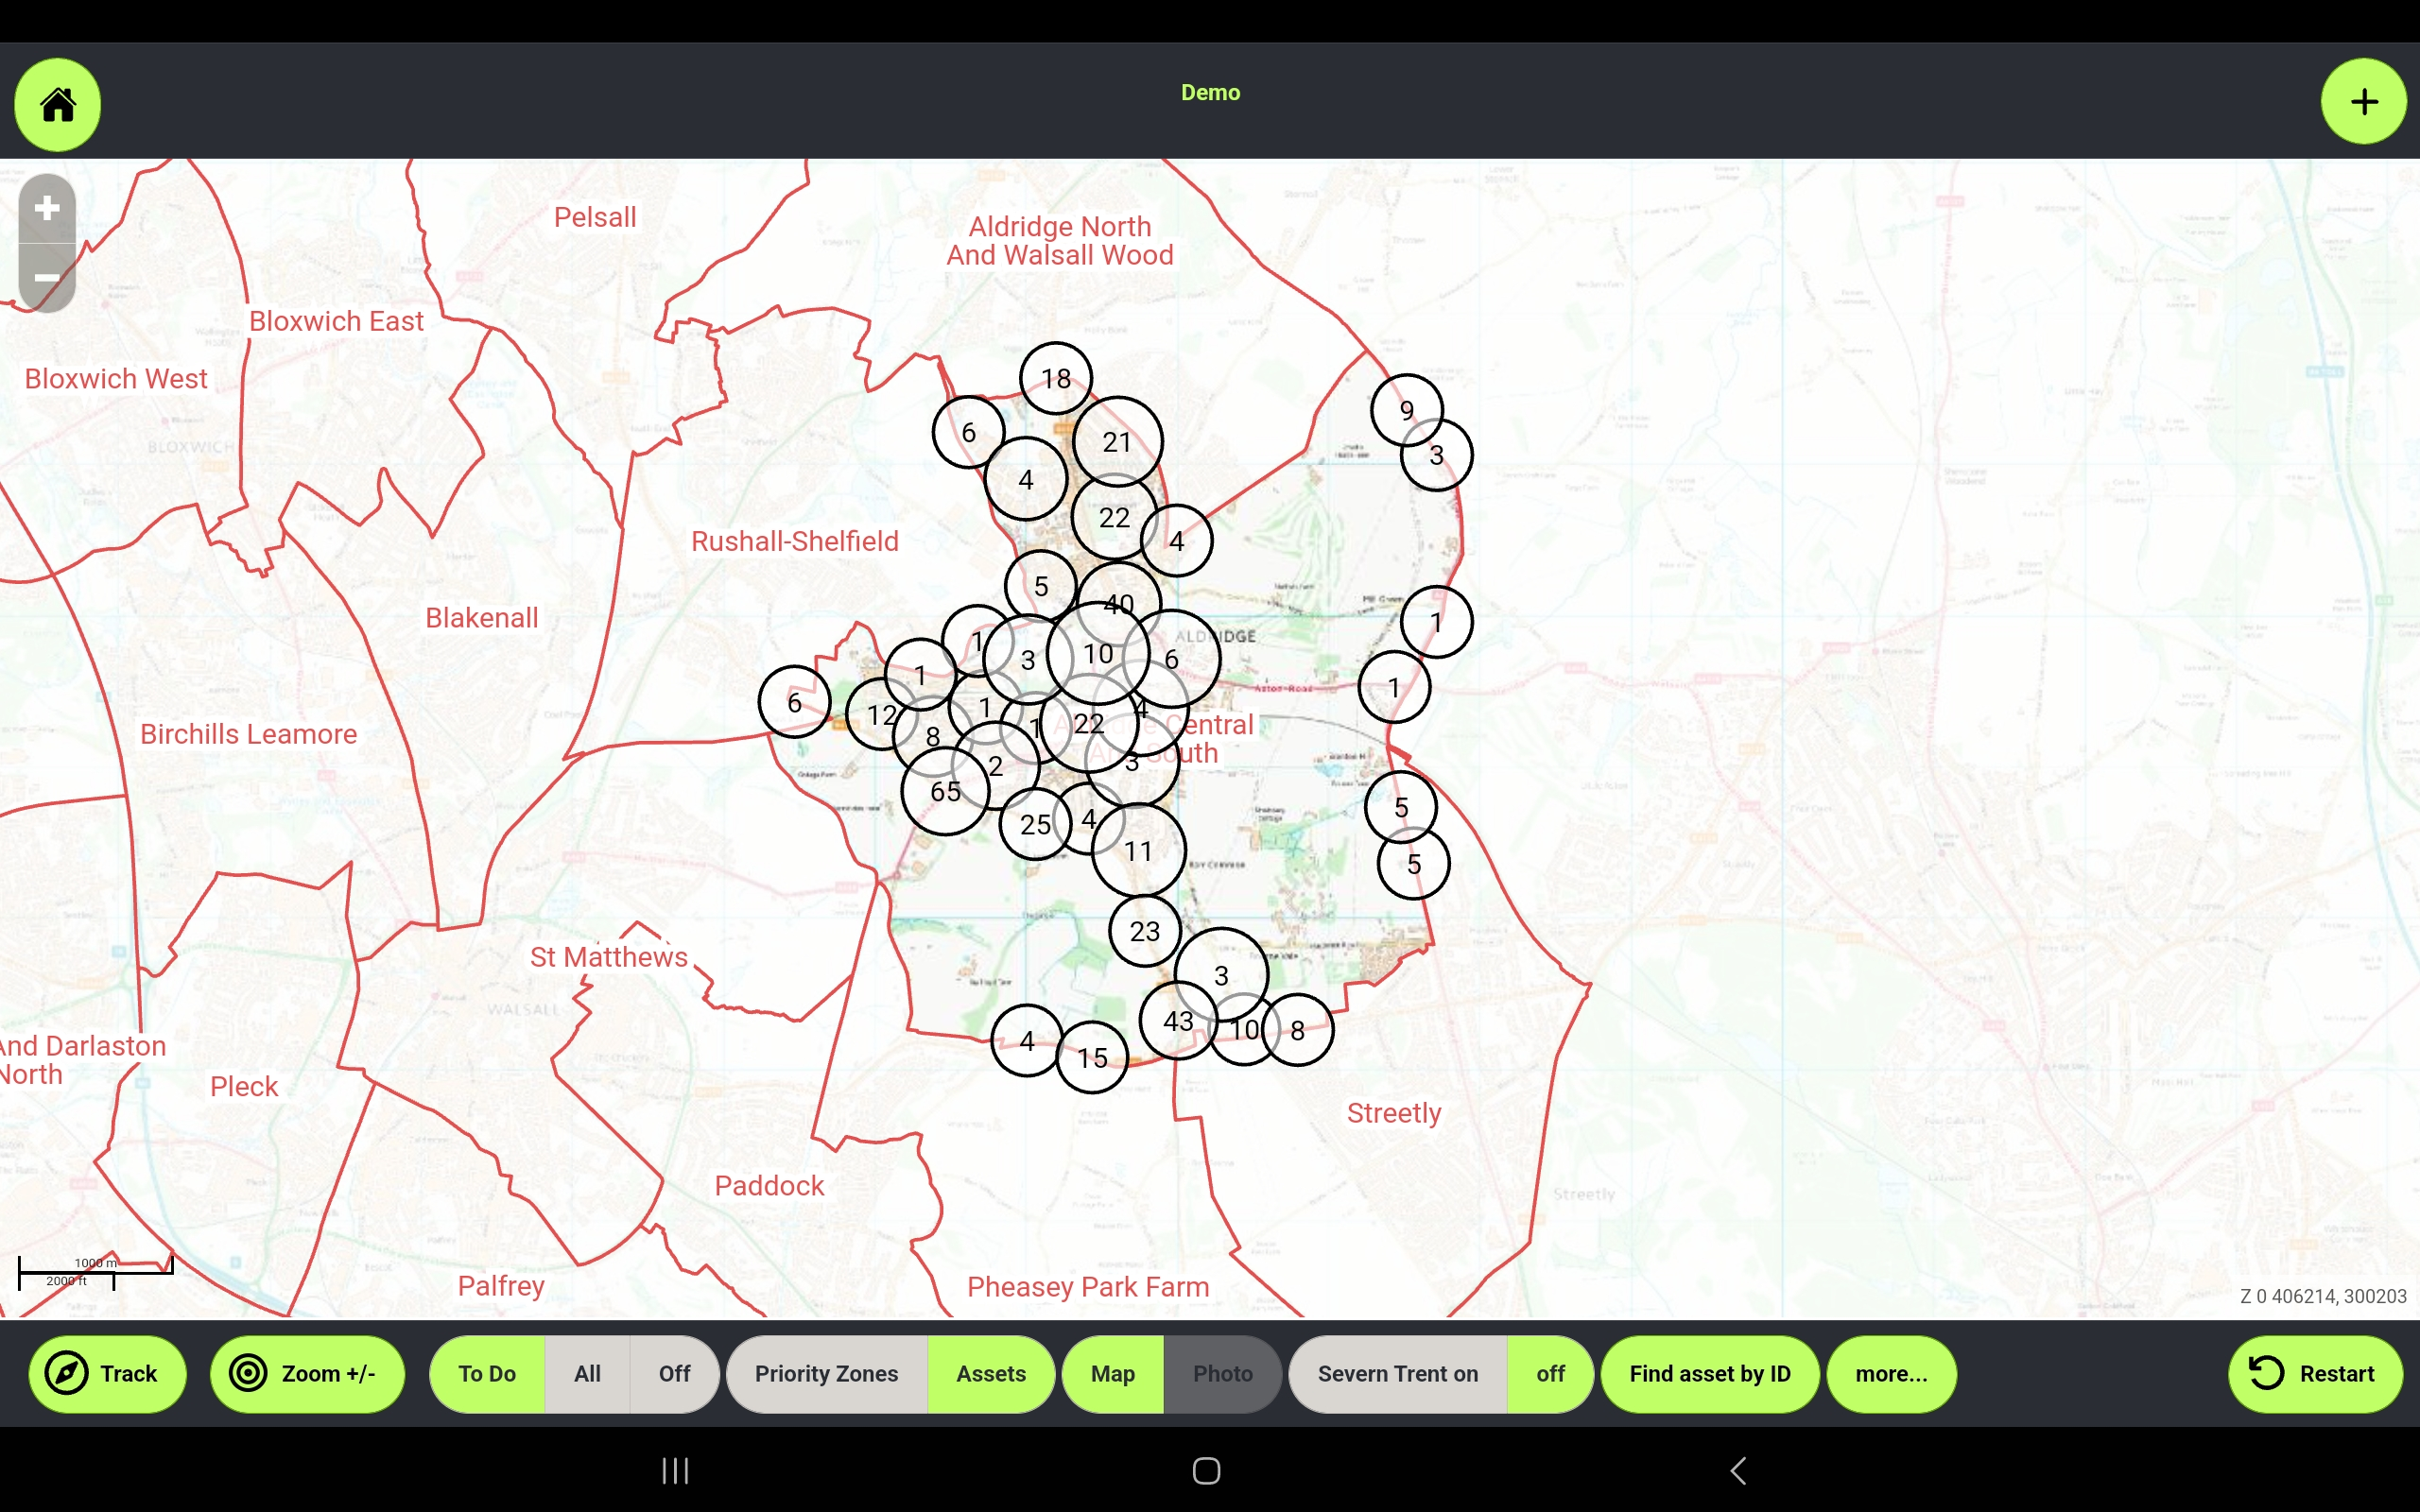
The numbers on the map are called clusters. Each cluster denotes a group of assets in that immediate area.

Due to the large number of assets that may be present in any given area, it would be impractical to show each individual asset on the map at all zoom levels. Therefore, when you are zoomed out to show more of the map, the individual assets will be clustered into groups and the group is displayed instead.
As an example, here is a system where not all assets have been clustered. As you can see, this makes it very difficult to see the underlying map and identify local areas that you may want to select.

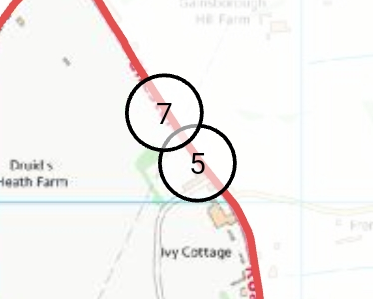
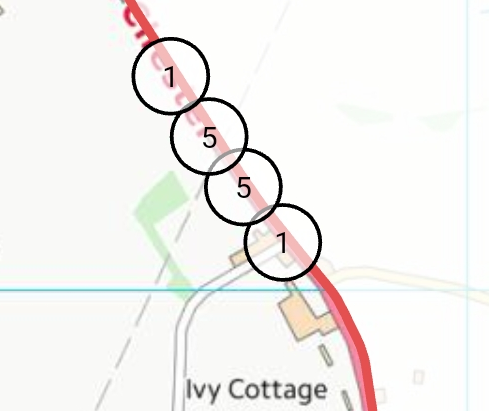
The cluster will display the number of assets in that group. Zooming in, you will see that at each zoom level, the clusters will reorganise and show smaller and smaller groups as fewer assets are visible at each zoom level.

Clusters at the outer zoom levels

Clusters split apart as you zoom in
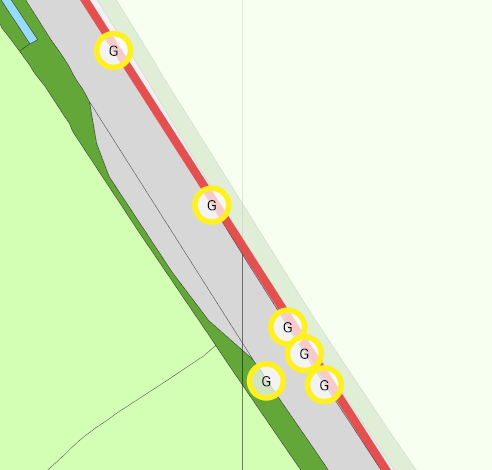
Once you zoom in close enough, the clusters will disappear as the individual assets are shown instead.

You can zoom in by any of the usual map control methods, or by clicking or tapping on the cluster in question. Each click or tap will zoom in one level. Once you get to the Mastermap levels, you will see individual assets.
