
The Grass SMART Activity Summary is a great way to see at-a-glance, the numbers of cuts carried out by your crews across a time period.
Running an Activity Summary
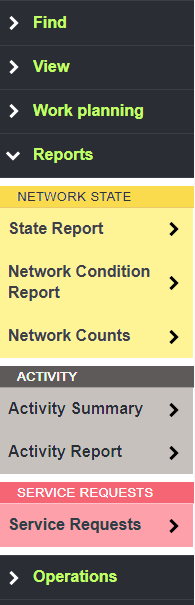
The Activity Summary can be found in the Reports section of the Main Menu.
To run the report, set the report options as required:
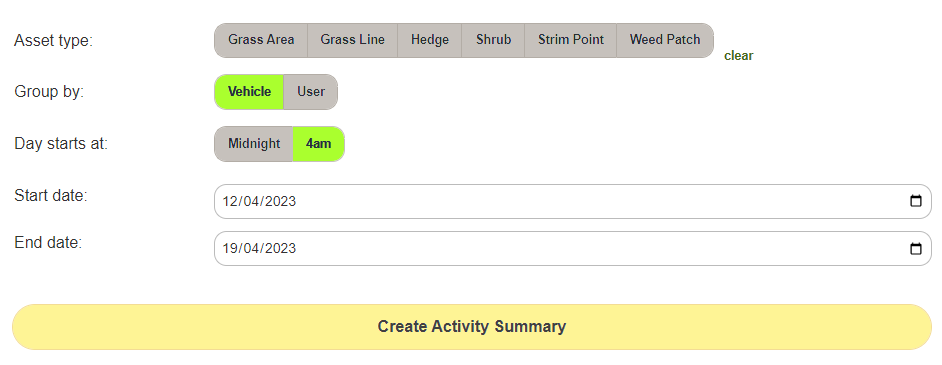
- Asset Type: Select the relevant asset trypes that you want included in the report, or leave at the default to include everything.
- Group By: Select to group the results by the vehicle registration, or by the username.
- Day Starts At: Select to either start and end each day at Midnight or at 4am.
Note: Selecting 4am sets the day to run from 4am to 4am the next morning. This allows you to include a night crews' whole shift into a single day rather than having their number split across two days when midnight is selected.
Set the Start and End dates to the required date range. If you require only a single day, set both start and end to the same date.
Click Create Activity Summary to run the report.

Your crews' activity is displayed in the results table.
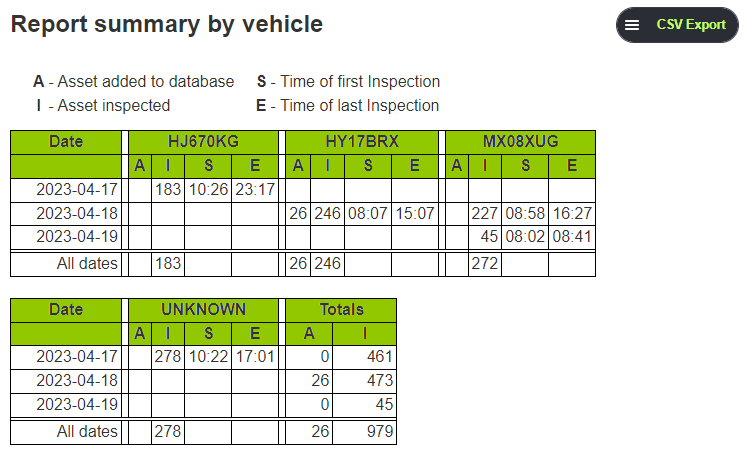
Click CSV Export to export the table to a csv file which can be interrogated in excel.